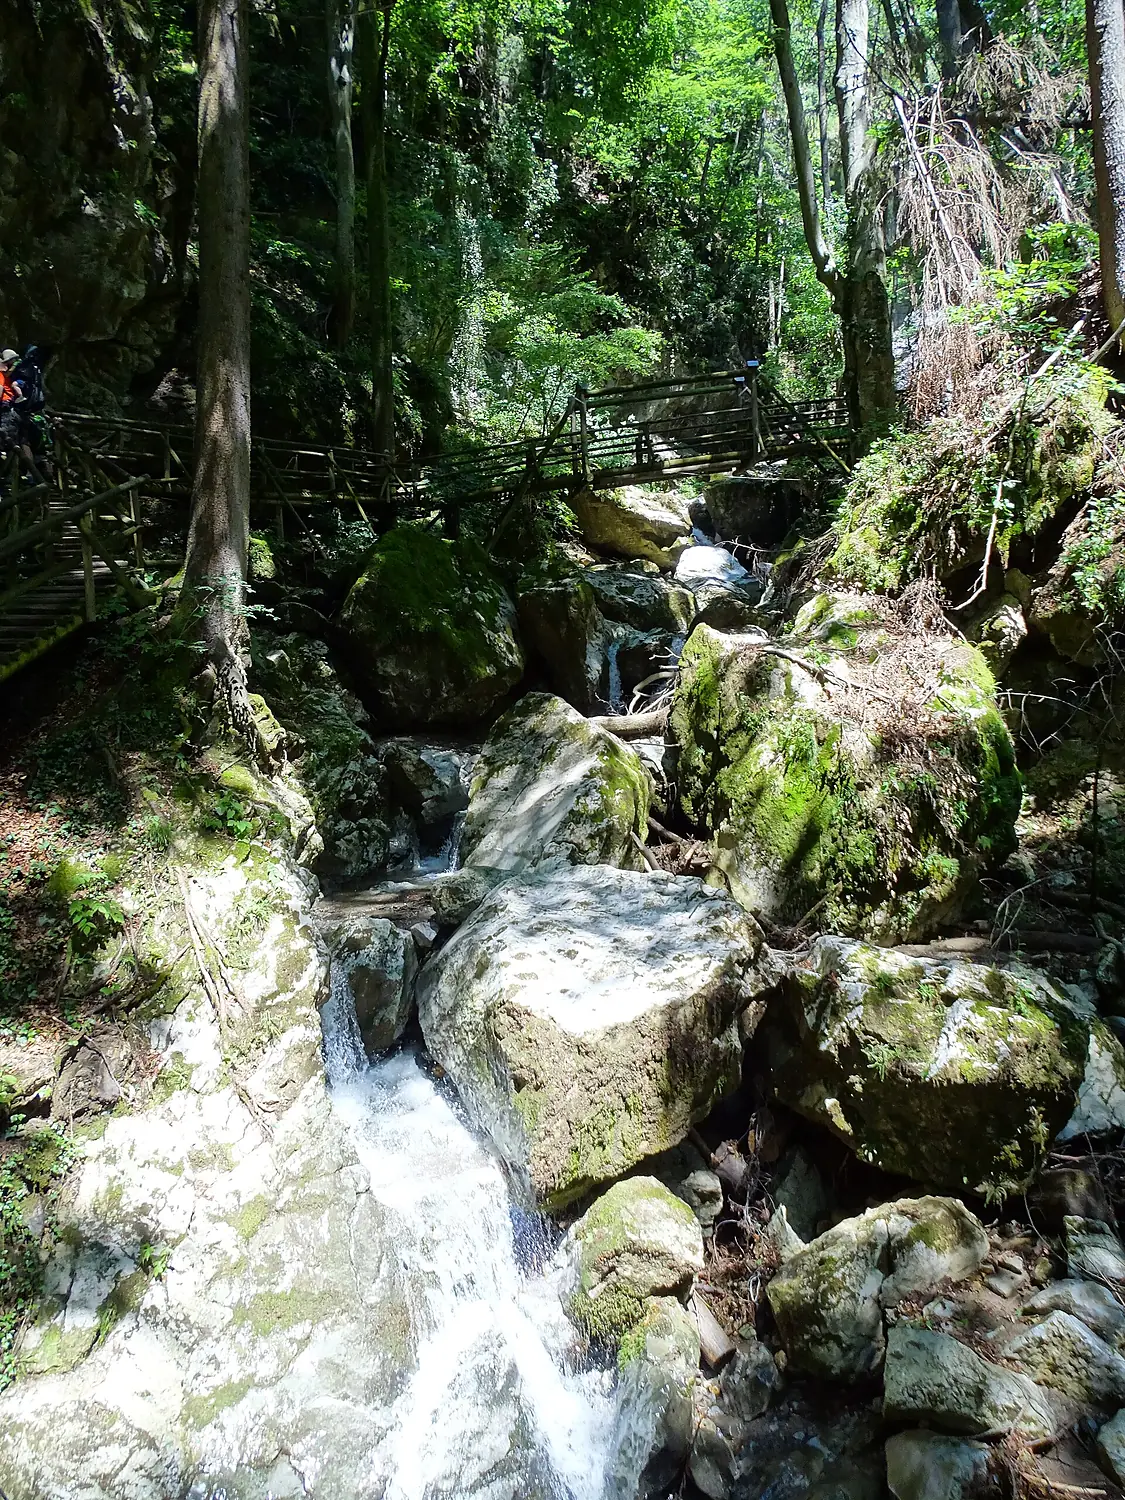
 Austria
 Liuthalas · CC BY-SA 4.0
The cut
570 metres, to scale.
A slice through Kesselfallklamm where it is deepest and narrowest, measured on the Copernicus relief model every 30 m. Same scale as the landmark standing on the floor.
Standing on the floor, to scale: Great Pyramid · 139 m · Empire State · 443 m
Depth is measured to the lower rim; the width is from rim to rim. A 30 m relief model smooths the narrowest walls, so a slot canyon reads shallower than it is. On one side the ground was still rising 12 km out: the true rim is further away and the canyon deeper.
570m
Depth
measured on the 30 m relief model
17.3km
Rim to rim
measured on the 30 m relief model
33°
Steepest wall
average over 300 m, from the relief
453m
Floor altitude
Rim to floor
4 °C warmer at the bottom.
In July the afternoon reaches 27 °C on the floor, against 23 °C on the rim. The best months to hike are in May and in September. The rim freezes at night from November to March. The wettest months are from June to September.
- 2°-2°Jan
- 4°0°Feb
- 10°6°Mar
- 16°12°Apr
- 20°16°May
- 25°21°Jun
- 27°23°Jul
- 26°22°Aug
- 20°16°Sep
- 15°11°Oct
- 8°4°Nov
- 3°-1°Dec
Afternoon highs, 1991–2020 averages (NASA POWER) brought to the altitude of the rim and of the floor with the standard lapse rate (6.5 °C per 1 000 m). Shade, wind and rock change this on the day. Not a forecast.
Kesselfallklamm is a gorge in Austria, cut by the Rötschbach river. The relief model measures 570 m from the floor to the lower rim. Rim to rim it is 17 km wide where the cut was taken.
Getting there.
- Semriachnearest town · 1.3 km in a straight line
- Parking 2,950 m awaynearest car park in OpenStreetMap, straight line
- Mitterbach Wasserfallnearest viewpoint · 0.5 km from the floor
- Graz Airport (GRZ)nearest airport with scheduled flights · 24 km in a straight lineCar hire at GRZ airport (Feldkirchen bei Graz)Discover Cars · sponsored link↗
- In May and in Septemberbest months to hike (estimate)
Plan the visit
Guided hikes, a bed nearby, a car.
Some links above are affiliate links: if you book through them we may earn a commission, at no extra cost to you. It never changes what the data on this page says.
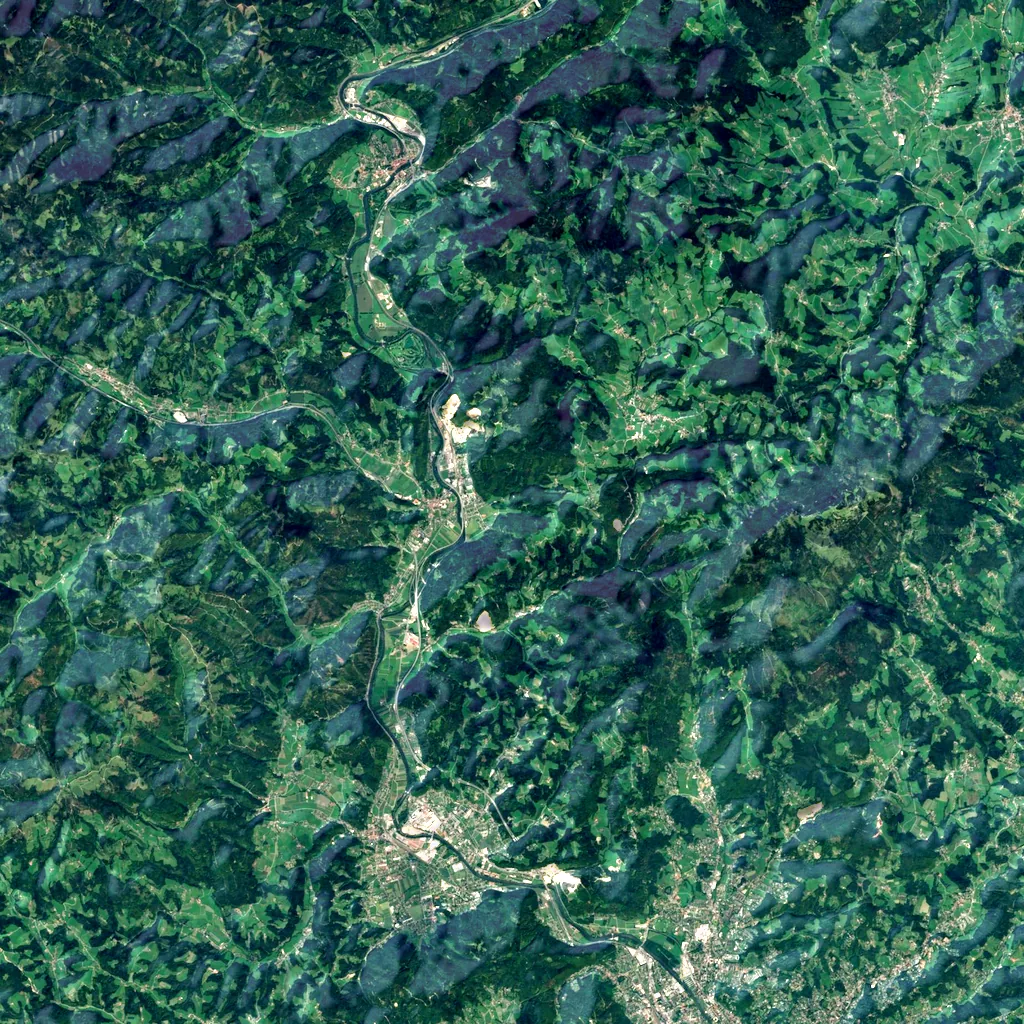
From the sky.
The canyon from above, with the relief shaded, the line of the cut, the river and what people have mapped around it.
 N
6 km
N
6 km
Sentinel-2 cloudless 2016 (EOX, CC BY 4.0), 24 × 24 km, north up. The line is the cut above. Points © OpenStreetMap contributors.
Around the canyon.
- 19viewpoints within 5 kmGipfelkreuz Schöckl, Mitterbach Wasserfall and 17 more
- 52marked hiking routes within 4 kmWanderweg 20, Rannach Rundweg 766, Wanderweg 757 Rund um den Schöckl and 49 more
- 1climbing crags within 3 kmLeopoldinengrotte
- 19footbridges and suspension bridges within 3 kmKesselfallsteig and 18 more
- 2named waterfalls within 4 kmKesselfall, Mitterbach Wasserfall
- 17caves within 3 km
- 21car parks within 3 km
- 49information boards and visitor centres within 4 km
- 15bus stops within 2 km
- 2campsites within 8 kmCamping Lanzmaierhof
- 24hotels and guesthouses within 8 kmLandhaus Rois, Dorfwirt, Hoaterwirt and 21 more
- 13restaurants and cafés within 4 km
- via ferrata routes within 4 km
- rafting, canoe, kayak or canyoning spots within 4 km
- swimming spots within 3 km
Counted in OpenStreetMap, the map anyone can edit, around the floor of the canyon. A low number may just mean nobody has mapped it yet. © OpenStreetMap contributors (ODbL).
Towns nearby
- Semriach1.3 km in a straight line
- Peggau3.8 km in a straight line
- Deutschfeistritz4.8 km in a straight line
- Sankt Radegund bei Graz7.5 km in a straight line
- Gratkorn8.8 km in a straight line
- Kirchenviertel9.1 km in a straight line
- Frohnleiten9.3 km in a straight line
- Andritz10 km in a straight line
In our other atlases
What else is around Kesselfallklamm.
The river that carved it, the waterfalls inside it, the mountains on the rim, the lakes, beaches and island nearby — from our six sister atlases, each with its own figures.
 Cascadyas1 waterfalls nearbyComing soon
 Peakyas106 mountains within 15 km
Figures from the sister sites' databases (Wikidata, HydroATLAS, GeoNames, NOAA, OpenStreetMap). Links open when each site is online.
Month by month
The weather, at the floor and at the rim.
| Jan | Feb | Mar | Apr | May | Jun | Jul | Aug | Sep | Oct | Nov | Dec | |
|---|---|---|---|---|---|---|---|---|---|---|---|---|
| Afternoon · floor | 2 | 4 | 10 | 16 | 20 | 25 | 27 | 26 | 20 | 15 | 8 | 3 |
| Afternoon · rim | -2 | 0 | 6 | 12 | 16 | 21 | 23 | 22 | 16 | 11 | 4 | -1 |
| Night · rim | -9 | -8 | -5 | 0 | 5 | 9 | 11 | 11 | 6 | 1 | -3 | -8 |
| Rain (mm) | 32 | 40 | 43 | 52 | 90 | 104 | 107 | 110 | 96 | 61 | 56 | 42 |
| Rainy days | 6 | 7 | 9 | 10 | 14 | 15 | 16 | 14 | 11 | 10 | 9 | 8 |
| Sun hours/day | 2.7 | 4.0 | 4.9 | 5.8 | 5.9 | 6.5 | 7.0 | 6.5 | 5.0 | 4.3 | 2.6 | 2.3 |
| Snow on the ground (cm) | 16 | 14 | 8 | 2 | 0 | 0 | 0 | 0 | 0 | 1 | 6 | 14 |
| Afternoon · floor | Afternoon · rim | Night · rim | Rain (mm) | Sun hours/day | |
|---|---|---|---|---|---|
| Jan | 2 | -2 | -9 | 32 | 2.7 |
| Feb | 4 | 0 | -8 | 40 | 4.0 |
| Mar | 10 | 6 | -5 | 43 | 4.9 |
| Apr | 16 | 12 | 0 | 52 | 5.8 |
| May | 20 | 16 | 5 | 90 | 5.9 |
| Jun | 25 | 21 | 9 | 104 | 6.5 |
| Jul | 27 | 23 | 11 | 107 | 7.0 |
| Aug | 26 | 22 | 11 | 110 | 6.5 |
| Sep | 20 | 16 | 6 | 96 | 5.0 |
| Oct | 15 | 11 | 1 | 61 | 4.3 |
| Nov | 8 | 4 | -3 | 56 | 2.6 |
| Dec | 3 | -1 | -8 | 42 | 2.3 |
Averages 1991–2020 (NASA POWER) for a cell about 55 km wide, brought to the floor (453 m) and the rim (1,065 m) with the standard lapse rate. Not a forecast.
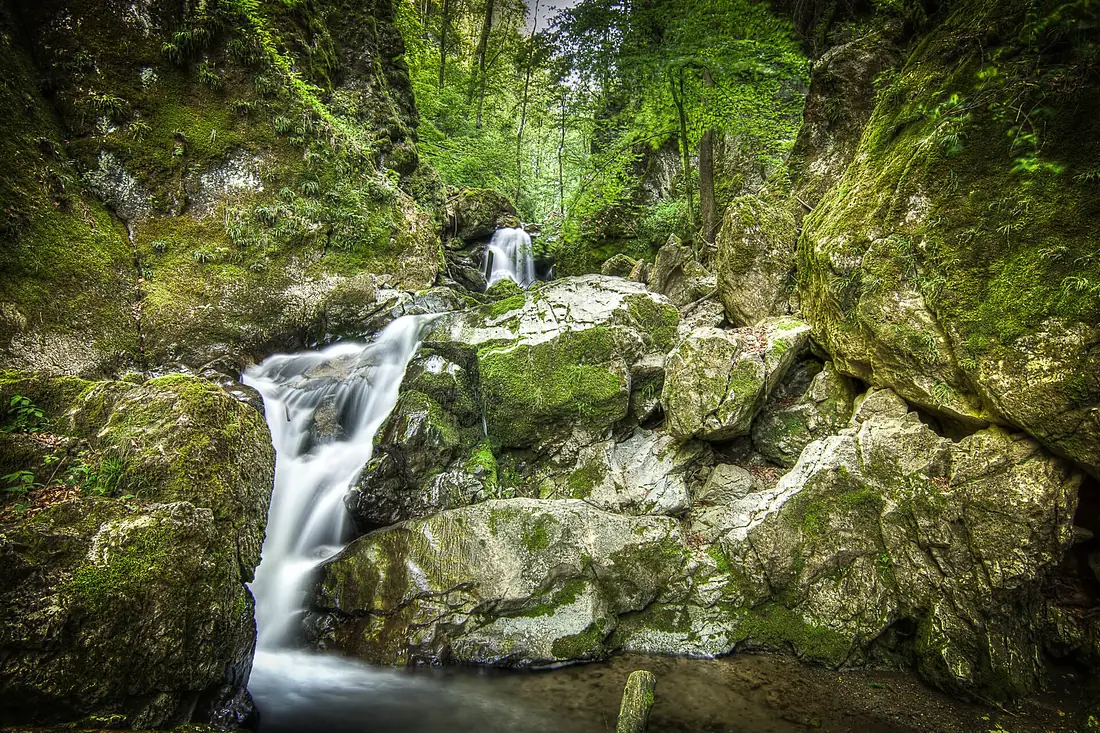
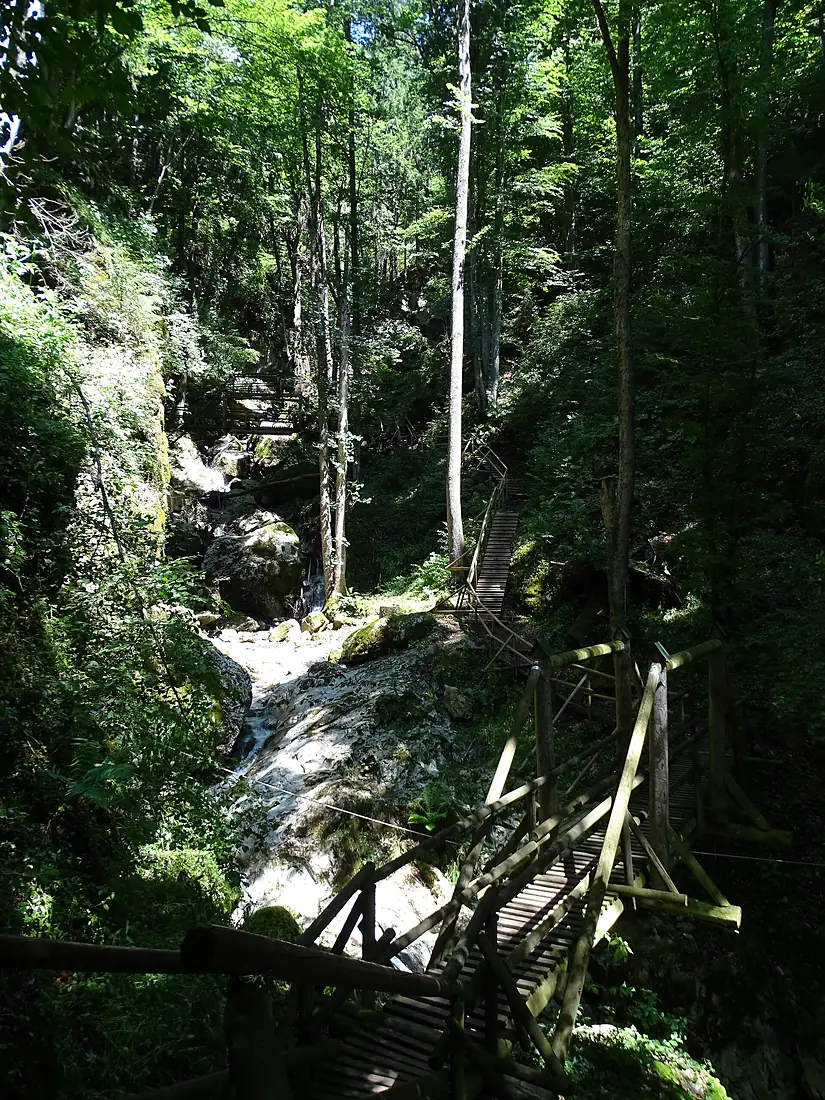
Photographs
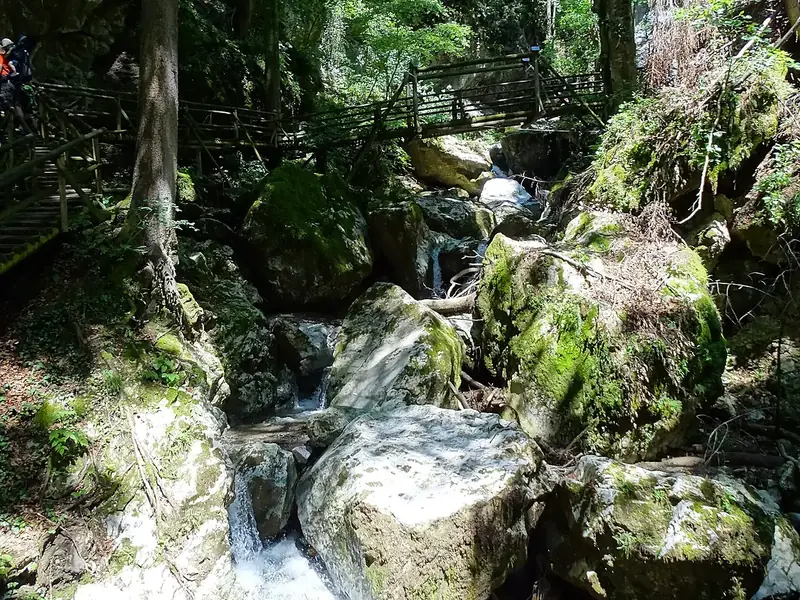
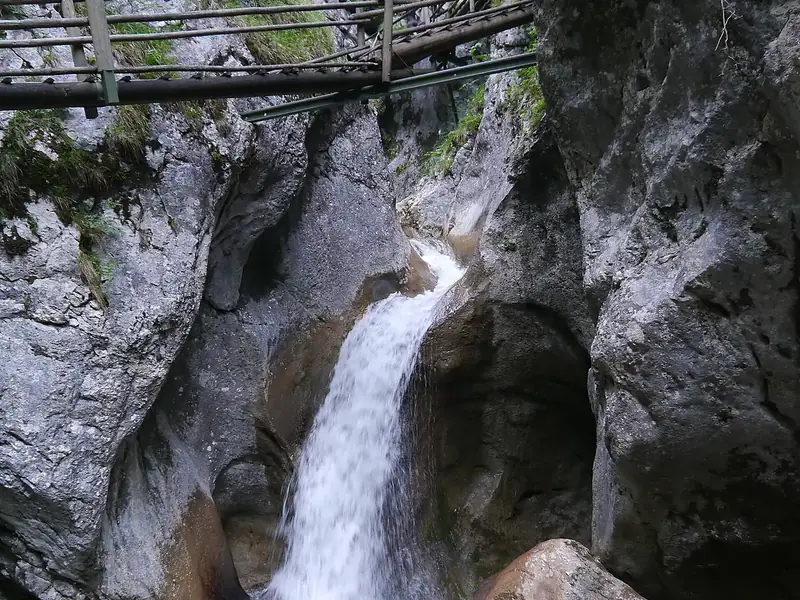
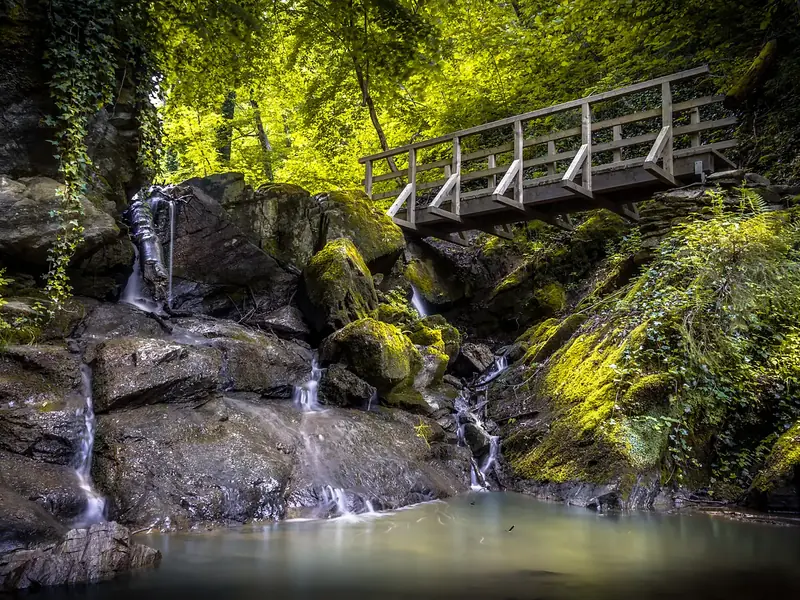
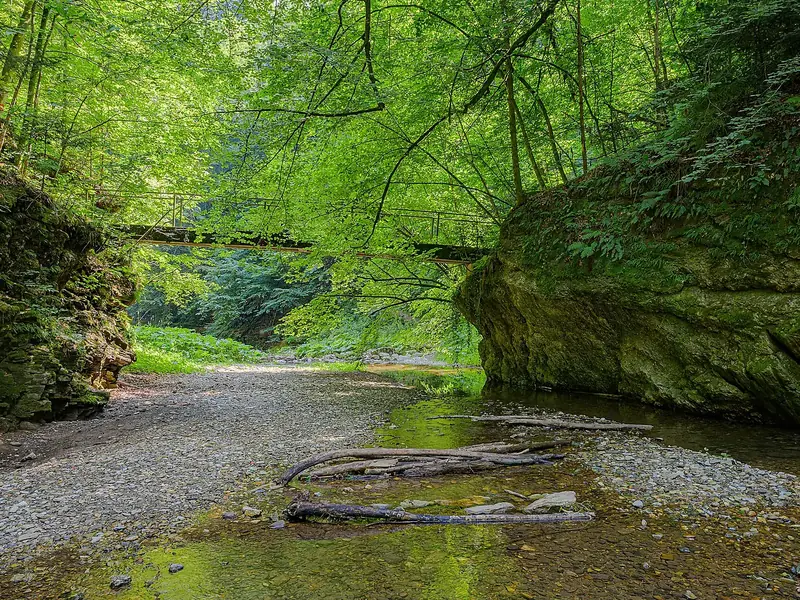
Seen from the trail.
Recent years
Wet years, dry years.
Rain of each month as a share of the 1991–2020 average. A dry year means a lower river and hotter rock; a wet one, more water in the gorge.
| Jan | Feb | Mar | Apr | May | Jun | Jul | Aug | Sep | Oct | Nov | Dec | |
|---|---|---|---|---|---|---|---|---|---|---|---|---|
| 2020 | 26% | 75% | 75% | 72% | 69% | 117% | 160% | 148% | 119% | 151% | 41% | 204% |
| 2021 | 149% | 56% | 46% | 65% | 156% | 44% | 86% | 107% | 44% | 68% | 135% | 136% |
| 2022 | 51% | 66% | 41% | 113% | 91% | 101% | 91% | 74% | 134% | 51% | 90% | 113% |
| 2023 | 266% | 55% | 159% | 164% | 154% | 111% | 212% | 160% | 26% | 150% | 131% | 209% |
| 2024 | 153% | 75% | 119% | 109% | 160% | 139% | 136% | 56% | 178% | 151% | 36% | 38% |
| 2025 | 86% | 63% | 219% | 156% | 90% | 55% | 139% | 59% | 125% | 83% | 107% | 59% |
130% or more: wet month 70% or less: dry month
Compare with the neighbours.
Kesselfallklamm
Austria
- 570 mDepth
- 17 kmRim to rim
- —Length
- 33°Steepest wall
Where these figures come from
| Name, type, published depth and length | Wikidata (Q21879199) · CC0 |
|---|---|
| The cut: depth, width, wall and 3D model | Copernicus DEM GLO-30 · © DLR e.V., © Airbus Defence and Space GmbH, Copernicus/ESA |
| Climate | NASA POWER, 1991–2020 |
| Viewpoints, trails, bridges and the river line | © OpenStreetMap contributors · ODbL |
| Images | EOX Sentinel-2 cloudless 2016 · CC BY 4.0; Wikimedia Commons |
| Rivers, waterfalls, mountains, lakes, beaches and islands nearby | Coastya, Lakeyas, Peakyas, Cascadyas, Islandyas, Riveryas |
Every figure is an average, an estimate or a count from a public dataset. Licences and methods: data sources.
The family
Do you prefer beaches, lakes, mountains, waterfalls, islands, rivers or canyons?
Same idea, other landscapes: field atlases built on open data, month by month, in seven languages.
 beaches
 Find your beach: sea temperature, sun and swimming month by month.Visit
  lakes
lakes Every lake on Earth: water temperature, ice, depth and the shore.Coming soonVisit mountains
 Every summit in 3D: summit weather, the 0 °C line, huts and trails.Visit waterfalls
 Every waterfall: height, flow month by month and when it roars.Coming soonVisit
  islands
 Every island from the sea up: size, sea temperature, ferries and 3D.Visit
  rivers
 Every river from source to sea: the journey, the flow and the basin in numbers.Visit
  canyons
 Every canyon cut to scale: depth to the floor, rim and floor temperatures, trails and viewpoints.You are here